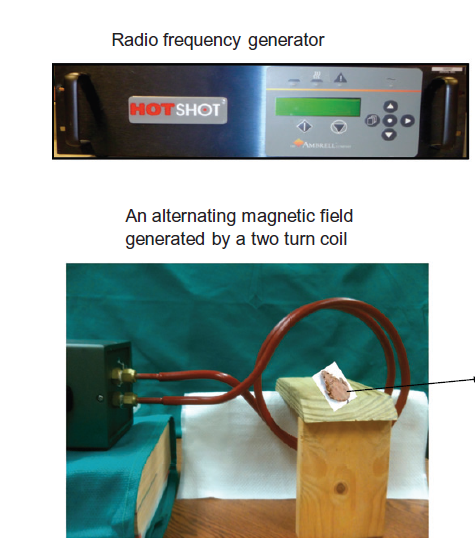
2. Experimental setup of an RF generator and a two-turn coil to inducing an alternating magnetic field
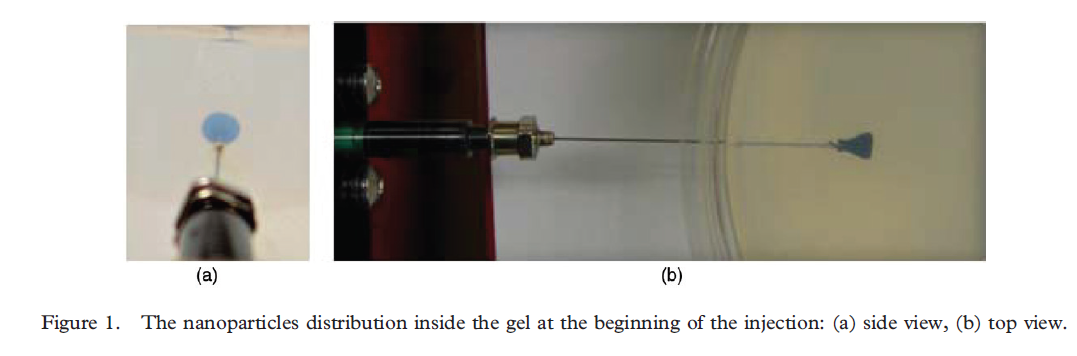
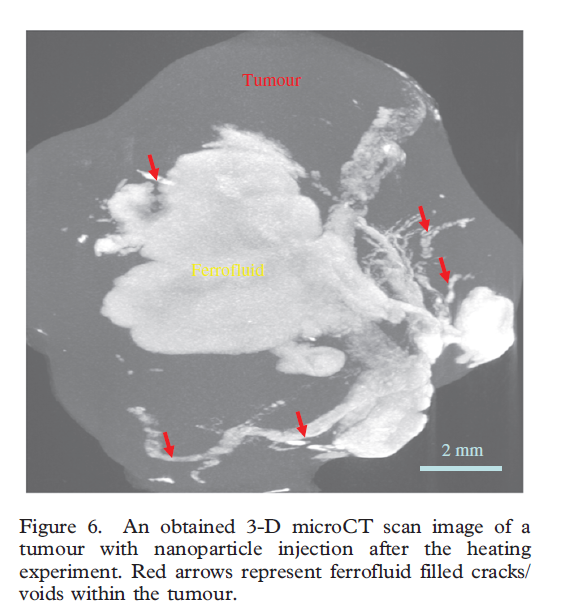
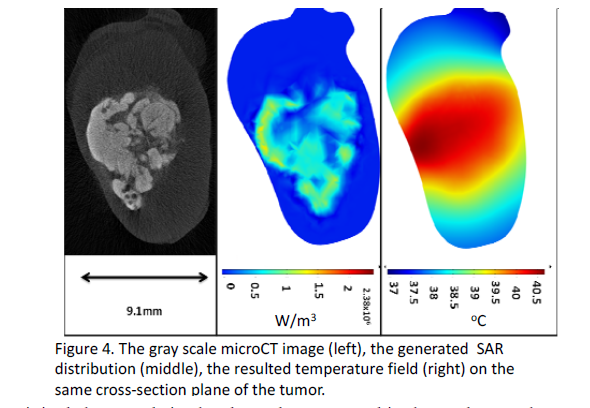
3. Nanoparticle distribution in a tumor is shown by a 3-D microCT image. Nanofluid is directly injected to the PC3 tumor implanted on mice. The tumor region containing nanoparticles has a density higher than that without nanoparticles, therefore, showing as brighter color in the micrCT images. Our experimental studies have suggested that the nanoparticle distribution is highly irregular. To obtain relatively controllable and repeatable nanoparticle distribution, the infusion rate should be very small (< 5 microliter/min).
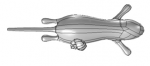
4. A generated tumor model embedded in a mouse body. Both are generated from the microCT scans using ProE software.
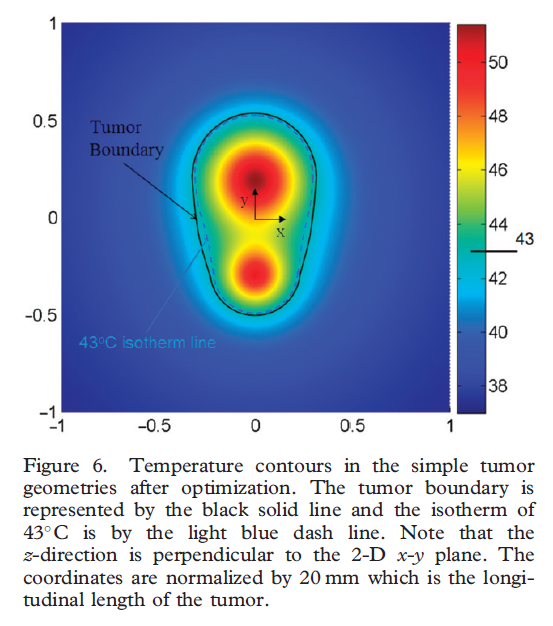
6. Design heating protocols to optimize thermal damage to tumor. The optimal heating protocol results in the theoretically predicted isotherm of 43C deviating little from the actual tumor boundary surface. This allows maximal thermal damage to the tumor while minimizing collateral damage to the surrounding tissue. This image was featured on the cover page of an issue of International Journal of Hyperthermia in 2008.